In a world where AI tools flood the business landscape — promising to automate decisions, predict trends, and solve complex problems — it's easy to feel overwhelmed. Can AI really replace strategic human thinking? How do you turn AI's data dumps into actionable, holistic business strategies? That's where we come in.
Business Cube Logics (BCL) — a domain-specific business ontology designed to be AI's "strategic navigator," not its replacement. A structured business semantic backbone that compensates for AI's weakest links in business applications: lack of inherent business context, fragmented data, and opaque decision logic.
Watch how Business Cube Logics evolved from a belief in structured business thinking into a complete domain ontology for CEO-level strategic cognition.
Our website is built for ambitious upper managers, post-MBA learners, and business enthusiasts who want more than buzzwords — they want structured, rational, holistic business thinking.
In an AI-driven world, foundational business thinking is more valuable than ever. Our educational content breaks down BCL's core principles with real SME case studies — cosmetics pricing, coffee shop market entry, retail inventory planning. No jargon, no abstract theories.
Learn to integrate BCL's "3 Cubes + 1 Panel" structure with AI tools to automate data integration, uncover hidden trends, and run what-if simulations — while keeping your strategy rooted in rational business logic, not AI's black-box outputs.
BCL was born to solve the "knowledge silo" problem of traditional business education. Integrate BCL with classic frameworks — SWOT, 5 Forces, balanced scorecards — and AI tools to create end-to-end strategies.
Collaborate with fellow SME leaders, share your BCL+AI success stories, and get answers to your most pressing business questions — because the best business learning happens when we learn with each other.
AI is changing how we do business, but it seems not feasible — at least in the near future — to replace the human ability to see the big picture, adapt to uncertainty, and align strategy with purpose. BCL is your tool to harness AI's power while keeping you in control of the strategic direction. Looking ahead, we see immense opportunities in the synergy between BCL and AI: as a robust semantic backbone, BCL can integrate seamlessly with AI to build highly automated, intelligent business systems.
To be the world's leading R&D body for business management knowledge — formalizing the CEO's worldview into a structured, relational vocabulary that empowers every business leader to make rational, holistic decisions in the AI era.
To research, develop, and promote the Business Cube Logics (BCL) framework — a domain ontology for strategic management — through education, publication, and community; and to equip managers with the structured thinking needed to harness AI while keeping human judgment at the helm of strategy.
Whether you're aiming to break through a career bottleneck, grow your SME, or future-proof your skills in the AI era — BCL Business Lab is here to guide you every step of the way. Subscribe now and let's turn structured thinking into your competitive advantage.
Get in TouchWe are a group of zealous people who have been devoted to the research and development of innovative thought in business education and application since 1993.
Never a doubt — it is and will be our life-long pursuance, simply because all these have been driven by our "belief" ever since its inception.
For more than three decades, our team has stood at the intersection of business engineering, strategic management, and management education — persistently refining a body of knowledge that turns the complexity of business into a rational, systematic, and teachable discipline.
商業立方邏輯研發有限公司
R&D in business management body of knowledge — promoting the BCL framework worldwide.
Business is not a collection of siloed functions. We believe in a basic, holistic, integrative, and systematic framework that mirrors the true complexity of enterprise.
We borrow frameworks, principles, guidelines, and systematic methods from conventional engineering to deal with the complexity of business — rationally and repeatably.
AI excels at processing data, but only humans equipped with structured thinking can turn that data into purposeful decisions. We keep you in control.
Business Cube Logics (BCL) is a framework designed to provide a holistic and systematic view of business operations, enabling rational management and decision-making — grounded in the principles of Business Engineering.
BCL is grounded in Business Engineering — an engineering-like approach that aims to create a basic, holistic, integrative, and systematic framework for business management, borrowing elements from conventional engineering to deal with business complexity.
BCL consists of cube structures, principles, rules, and logics: 3 cube wireframe structures (Company Cube, Market Cube, Regional Economic Cube) and 1 square panel (Global Trend Pane).
BCL contains business reasoning logics for process efficiency, financial index analysis, strategic planning, and market trend forecasting — analyzing business potential from profit and volume perspectives, and assessing market risks and opportunities. A color-signaling method visually represents element and relation status for scenario analysis.
BCL integrates internal and external environmental factors in a macro–micro rationale. The panes and cubes cover every level of the business environment — from the micro-level financial status of an enterprise to the macro-level global economic environment — revealing how different factors interact and impact business operations.
BCL supports strategic positioning through concepts like the P&V (Profit–Volume) Strategic Positioning Concept. Enterprises use different combinations of P and V to determine their relative strategic positions and make strategic plans accordingly.
An Ontology is a formal, explicit specification of a shared conceptualization (Gruber, 1993). It defines:
"Business Cube Logics" is exactly a domain ontology for strategic management — we are formalizing the CEO's worldview into a structured, relational vocabulary of 28 core business elements and their lawful interactions. A business is situated against a market context, which in turn a regional economy and global context.
Frameworks like ARIS, TOGAF, and the Zachman Framework are enterprise ontologies — mostly IT-system-centric. The Business Model Canvas operates primarily within the Market Cube (value creation and capture logic). BCL is purpose-built for the cognitive task of the CEO — a top-management-centric enterprise ontology and a formal ontology for CEO-level strategic cognition.
Ten short vertical videos introducing the BCL system — each one walks you through a key aspect of the framework, from cube structures to reasoning logics.
The 3 Cubes + 1 Panel at a glance
8 elements of enterprise capacity
Competitors, customers & price
GDP, technology & living standards
4 exogenous trend elements
How elements connect meaningfully
Visual status & scenario analysis
Profit–Volume strategic positioning
The semantic backbone for AI tools
BCL in real business decisions
Our study of "Business Cube Logics" is a formal domain ontology for CEO-level strategic cognition — constructing a structured, relational basic vocabulary of the business world that decomposes into three configurational cubes (Company, Market, Regional) of 8 vertices each, positioned within a Global Pane of exogenous trends.
Practical, case-driven programs designed for working professionals — from SME management to incumbent CPAs aiming for the management level.
An introductory program embedding the video "BCL3DBusinessDecision", guiding SME managers through the 3D decision-making logic of the BCL framework with real business scenarios.
Target audience: SME management with experience, or holders of a college degree in business management.
 English version
 Cantonese version
Designed for incumbent CPAs who want to upgrade to management level — or to have articulate communication with upper management — by mastering the BCL managerial accounting framework.
Target audience: Incumbent CPAs with some business experience, wanting to upgrade to management level or communicate articulately with upper management.
(Details to be announced)
Since 2002, we have published books, research papers, training manuals and articles — and developed tools and courseware that bring Business Engineering to life. Source: Institute of Business Engineers — Pub&Dev.
Developed for the members of HKICPA — upgrading accounting professionals into business-savvy CPA+.
China Renmin University Press (中國人民大學出版社), ISBN 978-7-300-22640-8.
Published in a HKICPA periodical.
"Shouldn't 'Engineering Business' be Needed Before 'Business Engineering'?" International Journal of Applied Engineering Research (IJAER), pp. 13381–13398, v.12, no.23, 2017. Read the paper ↗
SCPG Publishing Corporation, US — ISBN 978-1-938368-09-7.
Shanghai People's Publishing House — ISBN 978-7-208-08073-7/F-1793.
Shanghai People's Publishing House — ISBN 978-7-208-08023-2/F-1780.
"PVC Enterprise Management System" (PVC 企業管理系統) ISBN 988-97625-2-8 · "BQ Entrepreneurship System" (BQ 企業家商業智慧系統) ISBN 988-97625-3-6 · "Business Matrix Application Manual" (商智利量衡應用手册) ISBN 988-97625-6-0.
Joint publication with Dun & Bradstreet — ISBN 962-7240-51-6.
Three decades of devotion to innovative thought in business education and application. Milestones adapted from the Institute of Business Engineers.
We restructured the business model, built BCL promotion channels (YouTube and WeChat Channels), and created courses for enrolment on Teachable and Qianliao.
Continuous publication of management articles in local economic and management journals, extending the reach of Business Engineering research.
Development of the 8-module "FCCP" (From CPA to CPA+) online courseware for members of the Hong Kong Institute of Certified Public Accountants.
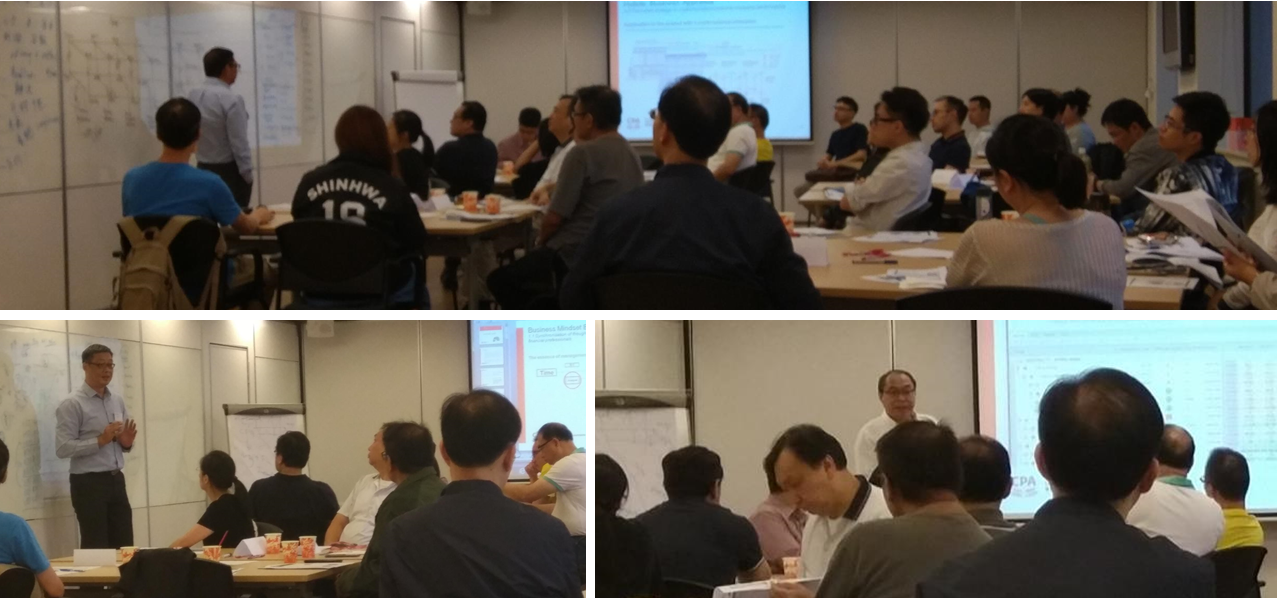
Publication of "大道至簡 — 商業思維的革命" (China Renmin University Press, ISBN 978-7-300-22640-8) and the article "The Closest Linkage ever Between Accounting and Strategic Management" in a HKICPA periodical.
2014 May - our core team paid a visit to St. Gallen University and conducted an academic exchange with Professor Robert Winter and Dr. Jochen Mueller.
2014 Nov. - Professor Robert Winter and Dr. Jochen Mueller paid a visit to our Guangzhou office for academic exchange.
Academic exchange at St. Gallen University
Publication by SCPG Publishing Corporation, US (ISBN 978-1-938368-09-7) — bringing the business engineering mindframe to a global audience.
Completion of the project -Risk Management Simulation Training Program Development Project, entrusted by the World Bank - Beijing National Accounting Institute (北京國家會計學院)
Establishment of the Academy of Business Engineering (HK)
Providing a course "Business Engineering and PVC-BQ System" at Hong Kong Productivity Council (香港貿易促進局)
Providing a corporate training program to the senior managers of the Bank of China (Hong Kong)
A series of publications establishing the Business Engineering PVC-BQ decision and management system — including "Business Engineering PVC-BQ System" (2008), "Business Sense" (2010), and the joint publication with Dun & Bradstreet (2002).
A group of zealous people devoted to the research and development of innovative thought in business education and application — a life-long pursuance driven by belief ever since its inception.
Our achievements are measured not in awards, but in the managers and entrepreneurs whose critical thinking we have helped to cultivate — enabling them to locate the causes of business problems instead of dwelling on the effects, and to sustain their companies' long-term development in the market.
Download our key publications and reference documents. Simply click the download button — files open in a new tab and can be saved to your device.
PDF · A practical checklist for SME decision-making
A sound business decision sits at the intersection of company capability, market dynamics and the external environment — balancing profit, volume and continuity.
⬇ DownloadPDF · SME Decision Guide
Why one-dimensional decisions quietly kill your business — and how to escape the Sales Trap (blind price wars), the Expansion Trap (chasing hotspots beyond capacity), the Cost-Cutting Trap (killing future growth), and the Compliance & Environment Trap (ignoring macro shocks) by seeing every move through the three cubes.
⬇ DownloadPDF · Strategy self-assessment tool
A practical self-check map that walks you through the Company.Cube, Market.Cube and Regional.Cube + Global.Panel — helping you locate your strategic position, spot missing factors, and verify whether your capacity, market dynamics and external environment are aligned before you commit resources.
⬇ DownloadPDF · Leading decisions with AI, not by AI
How executives can harness AI as a strategic accelerator while keeping human judgment in command — using BCL as the business semantic backbone to ground AI outputs, validate feasibility against real capacity and capability, and keep the "Why?" and "How?" of strategy firmly in human hands.
⬇ DownloadIf you are looking for a particular publication, training manual, or research paper, contact us directly at BCL.Enquiry@businesscubelogics.com and we will be happy to assist.
Everything you need to know about Business Cube Logics — from foundational concepts to sandbox simulation. Use the search box to filter by keyword, or browse by category.
Business Cube Logics (BCL) is a holistic, visual structural operating system and strategic reasoning framework designed for executive decision-making. Unlike traditional static management tools, BCL maps the dynamic cause-and-effect linkages across 28 core elements (nodes), capturing key factors distributed among internal enterprise capabilities (Company.Cube), market competitive structures (Market.Cube), regional macroeconomic conditions (Regional.Cube), and global trends (Global.Panel).
BCL solves the "single-dimensional decision trap" and data overload. Modern leaders often react to performance pressure using localized interventions — such as blind price cuts or across-the-board budget reductions — without understanding systemic trade-offs. BCL provides a unified holistic framework that connects 1st Panel's financial results down to operational process capacities, preventing accidental missing factors and unbalanced thoughts.
BE is the use of the engineering approach to create a basic, holistic, integrative, and systematic framework for rational business management and decision-making. It is the underlying principle that supports and underpins the BCL system.
Because it shares engineering's characteristics: frameworks, principles, guidelines, procedures, tools, and metrics applied to complex, large-scale, environment-dependent problems. It cannot fully mimic physical engineering (experimentation is often infeasible in business), but it brings the same systematic rigor.
Concepts lay out definitions, constraints, and the essential nature of business elements — the building blocks, including Ultimate Enterprise Objective (PVC); Efficiency & Effectiveness; Management-Orientation; Macro-Micro Perspective; Time-Management; Balance & Matching; Capacity & Capability; Potential (Opportunity/Risk); IN-OUT; Four Core Business Functions; Business Process Chain; P&V Strategic Positioning.
Principles suggest ground rules and guiding notions for how to respond to circumstances — rules of thumb for achieving goals, including Resource-Limitedness; Function-Combination; Time-Lag; Management-In-Order; Environment-Impact; Development-Sustainability; Goal-Appropriateness; Analysis-Relationship; Forecast-Change; Problem-Essence.
Essence is the basic, pivotal truth of a matter (e.g., cholesterol level for heart disease); manifestation is its observable appearance (e.g., obesity). Effective problem-solving must target the essence, not the surface symptoms.
BCL evaluates enterprise strategic goals using the PVC Dynamic Equilibrium Equation:
PV = Unit Profit × Sales Volume of the current year.
Continuity (C) = the sum of (Unit Profitt × Sales Volumet) over future years t = 1 to N.
It dictates that an enterprise's current-year Unit Profit (P) and Sales Volume (V) must be balanced against the sustainable PVs in subsequent years (Continuity (C)) to achieve the enterprise's ultimate objective.
PV is this year's net profit; C is the health producing future PVs. Sacrificing the future for today (or vice versa) destroys total value — without today's survival there is no future, and without future investment there is no sustainability.
The combinations of High/Average/Low Profit with High/Average/Low Volume: HP-HV, HP-AV, HP-LV, AP-HV, AP-AV, AP-LV, LP-HV, LP-AV, LP-LV. They attribute a company's relative strategic position at a point in time.
Management functions should be tied to three time frames: N-1 (analyze, review, audit), N (adjust, execute, direct, control, organize, prepare), N+1 (forecast and plan). It answers "what should I do, and when?"
Capacity is the current state of resources (production scale, channels, workforce) to capture existing market potential (time frame N). Capability is the adaptive ability and other necessary abilities to drive, build, and reshape capacity to match the N+1 environment. Capacity captures today's opportunity; capability secures tomorrow's.
Business must be viewed along the impact chain: Global → Nation → Local → Industrial → Enterprise. Walking macro-to-micro projects the future; walking micro-to-macro analyzes and explains past performance.
AI excels at localized data processing, trend detection, and option generation, but lacks context regarding multi-year enterprise risk. BCL serves as the structural human reasoning engine that executives use to evaluate AI outputs, weigh cross-functional trade-offs, and make high-accountability strategic choices.
BCL does not replace existing theories — it is the architectural framework that connects the theories you already know into a single, operable system for holistic reasoning, simulation, and strategic decision-making.
The core system models a business unit with a single product; multi-product businesses are handled by extension — one cube set per product/business unit, integrated under the corporate level.
Strategy View, Function View, Process View, Task View, Resource View. BCL primarily spans the top two (strategic and functional); the lower three concern implementation.
The BCL Ontology is the complete structural architecture mapping the 28 core operational, market, regional, and global elements that dictate enterprise performance. It provides a standardized data schema across four modules:
8 per cube plus 4 on the Global Panel:
Edges connecting two elements, each representing a meaningful business activity, indication, or influence. 39 relate to management and operations; 6 relate to financial performance (e.g., ROA, ROE).
The Company.Cube comprises two Panels: Financial Performance, and Functions & Resource Allocation. The Financial Performance Panel includes four elements: Capital, Assets, Revenue and Profit, while the Functions & Resource Allocation Panel covers an enterprise's four core functions and the resource allocation between them.
The 4 Core Functions form the internal operational pillars of the enterprise:
The 9 phases represent the sequential operational lifecycle across the firm:
The enterprise's internal factors — its capacity and capability, efficiency and resource allocation — via Equity, Asset, Revenue, Profit (Financial Performance Panel) and Finance, Production, Marketing, Management (Functions & Resource Allocation Panel).
Panel 1 (Financial Performance Panel) measures traditional financial outcomes to gauge baseline business health. Key metrics include:
BCL uses Panel 1 as an initial alarm system rather than a final diagnosis — identifying that a problem exists before moving to Panels 2 and 3 to discover why.
The Market Cube comprises 2 Panels:
Together they describe the external market situation the enterprise confronts: who you compete with, whom you sell to, the margin space between market price and industry cost, and the demand potential driven by population and disposable income.
The Regional.Cube captures local economic conditions through 8 key variables:
The Global.Panel tracks worldwide trends that propagate downward into regional markets:
The 4 strategic interactions are the direct links between the Company.Cube and the Market.Cube — each one represents a requirement that the market imposes on an internal function, defining the four arenas on which enterprises compete:
Industry Conditions (IC) are external forces shaping the profit and volume opportunities or threats for all enterprises within the same market:
Substitutes compete directly for the customer's limited purchasing power and Customer demand fulfillment. Even if a substitute operates in a different product category, it sets an upper ceiling on what customers are willing to pay, constraining the firm's pricing power (Price) and available margin space.
Industry Possible Margin is the structural gap between current market-accepted pricing (Price) and baseline industry costs (Cost):
Possible Margin = Market Price − Industry Cost
It defines the total available profit potential within a product category before individual firm efficiencies are applied.
BCL links financial results to operations through a built-in, three-tier causal structure — no separate diagnostic mechanism is needed, because the connections are encoded in the framework itself:
The 2nd Panel (Functions & Resource Allocation Panel) ratios evaluate the return generated by the expenses in each of the 4 Core Functions within Company.Cube:
Expenses or costs in the formulas above represent total costs within their respective functions. For deeper analysis to support cost reduction or optimization, costs may be broken down into variable and fixed costs for calculation.
The Tier-3 measures physical and process throughput capacities. Common capacities metrics include:
BCL performs this through Performance Tracing — walking the framework's causal chain from financial outcome to operational root cause:
SWOT is simple but vague — different analysts reach different conclusions on the same business. BCL encodes defined elements with causal relations and cross-verification, making analysis consistent, rigorous, and simulatable.
Five Forces analyzes industry structure but ignores internal capability. BCL's Market Cube covers competitive structure and links it via 4 strategic interactions to the Company Cube's capacity and capability.
The Scorecard links metrics to strategy but does not model causation. BCL models the causal chain itself (macro → market → functions → financials) and its KPI Signal Layer cascades from that causation down to actionable recommendations for specific processes across the business chain — rather than merely deriving KPIs from strategic themes.
Structurally similar, but the Value Chain is product-centric; BCL's Business Process Chain represents the full business cycle (Management → … → Profit → Management) with cause-effect logic, time-cost efficiency, process performance evaluation through KPIs, and PVC alignment.
PEST scans the macro environment but doesn't connect it to internal performance. BCL embeds macro factors in the Regional and Global structures with explicit causal paths down to the enterprise's P, V, and C.
Integrate. BCL is the architecture connecting familiar theories into one operable system — their insights become inputs colored and verified within the cubes rather than standalone, disconnected analyses.
Combining them still leaves the integration to individual intuition. BCL provides what none offers alone: the whole business captured, causal relations encoded, a visual model that fits the mind, a sandbox for simulation, and a basis for a certifiable body of knowledge.
Dashboards display outcomes; BCL explains and projects them. It traces financial results back through functions, market, and macro tiers (micro-to-macro) and simulates how environmental change will flow forward into future results (macro-to-micro).
While the Business Model Canvas (BMC) serves as an excellent static, 2D mapping tool that categorizes enterprise components into 9 building blocks (including Key Activities, Value Propositions, and Revenue Streams), BCL operates as a dynamic, holistic, highly structured model and causal reasoning engine. It comprises 4 layers represented by 3 Cubes (Company, Market, Regional) plus 1 Panel (Global Trend), alongside 28 elements and 49 relationships.
The BCL Sandbox is a modeling methodology where executive teams inject potential scenario data (such as raw material inflation, competitor price cuts, or supply chain bottlenecks) into the corresponding elements to trace ripple effects across margins, working capital, business process chain and competitive dynamics before executing decisions in the real world.
BCL acts as a structured logical engine rather than a static reporting template. It provides the holistic architecture that executive leaders use to process unstructured market data, evaluate cross-functional trade-offs, and deduce the systemic outcomes of strategic moves before deploying capital.
Assigning five colors to elements and relations to show status: Blue = very favorable, Light Blue = favorable, Yellow = unchanged, Light Red = unfavorable, Red = very unfavorable — giving an instant visual overview of the whole business situation.
Change the state of one element and trace the impact along the relations through the cubes — e.g., GDP → Standard of Living → Disposable Income → Potential(P)/(V) → the enterprise's P and V — to simulate consequences before acting.
With input and output fixed, cost and time are inversely but non-linearly correlated — spending more can shorten time (doubling workers may halve time on simple tasks), but the exact relation varies by task. Understanding it lets you pick the strategy fitting your corporate advantage.
Running a BCL Sandbox Simulation involves four sequential steps:
The Sandbox runs two simultaneous financial and operational trajectories:
Executive Decision: Select Trajectory B during uncertain economic cycles (State of Economy↓) to protect cash reserves.
A drop in Consumer Confidence increases price elasticity in Regional.Cube. In the Sandbox, attempting to drive Volume (V) through premium pricing triggers an immediate decline in conversion rates. The simulation directs management to pivot promotional messaging toward essential utility, offer flexible payment terms, or introduce smaller pack sizes to lower upfront purchase barriers.
The Sandbox evaluates the target region's Regional.Cube indicators (GDP, Disposable Income, Cost of Living) against Market.Cube competitive density (Player). It then stress-tests Company.Cube supply chain lead times and working capital needs (funding Accounts Receivable for 90 days), revealing the exact cash buffer required before launching regional operations.
By recording the pre-decision assumptions, elements / variables, and simulated projections in the Sandbox prior to execution, executive teams can conduct objective post-mortem reviews. This separates decision quality from random luck and refines the firm's strategic reasoning capabilities over time.
The Stress-Test Threshold is the extreme operational limit a firm can endure before liquidity is exhausted. The Sandbox tests multi-variable crisis scenarios (e.g., revenue drops 30% while raw material costs rise 15%, working capital and credit term) to determine the minimum cash buffer required to survive a severe market downturn.
The cost imposed by regulations is injected as an IC(P) profit driver in Market.Cube. The Sandbox calculates the cost burden across the 9-Phase Process Chain in Company.Cube, testing whether the expense should be absorbed via operational efficiency gains (Panel 2) or passed to end customers based on Market Price and product elasticity.
Modern business environments are too volatile for trial-and-error management. The BCL Sandbox provides executive leaders with a low-cost, holistic, visually oriented, high-precision environment to stress-test strategic assumptions, quantify risks, and align cross-functional leadership around a single, validated operational path.
After a tentative position is drawn, ask "Can we?": run what-if analysis to check whether the environment and internal capacity/capability provide the conditions for success, and identify which internal elements must change to hit the target.
The Cost-Cutting Trap occurs when executives attempt to protect short-term margins by executing uncurated, across-the-board budget cuts (e.g., cutting marketing or administrative expenses by 30%) in the Panel 2 (Functions & Resource Allocation Panel). In BCL, this could cripple the core functional efficiencies (the second panel of Company.Cube), damages future customer acquisition capacity, and degrades long-term enterprise value.
The Low-Margin Trap occurs when an enterprise operates in a market sector where the Industry profit margin (Market Price − Industry Cost) is extremely thin. In this zone, small increases in raw material costs (IC(P)) or slight dips in sales volume (V) instantly force operating margins into negative territory.
A production bottleneck reduces throughput volume (V), causing unsold raw material inventory to accumulate. This increases Days Inventory Outstanding, trapping liquid capital in physical assets and shortening available working capital in the Finance function. (Naturally, other factors also place pressure on finance.) This directly strains the Cash Conversion Cycle. To identify the bottleneck, we must examine the Investment decision process within the Business Process Chain.
Finance safeguards Continuity (C) by enforcing liquidity boundaries. It ensures that aggressive expansion strategies generated by Marketing or Production do not outpace working capital buffers, over-leverage debt ratios, or create unmanageable cash conversion gaps.
Misaligned incentives. Marketing aims to maximize Volume (V) through SKU proliferation and promotional discounting, whereas Production seeks unit cost optimization, leading to higher unit profit (P), via standardized, long-run manufacturing. BCL resolves this by forcing both functions to optimize for the unified P × V → C balance.
An unexpected surge in Sales Development (Phase 6) triggers immediate capacity demands in Production Decisions (Phase 4). If Investment Decisions (Phase 3) have not pre-funded inventory buffers, the firm experiences stockouts, delayed fulfillment (V↓), and brand erosion (C↓).
The Customer vs. Competitor ratio measures addressable customer demand (Customer) against active competitive capacity (Competitor):
To escape the Low-Margin Trap, a firm must analyze the demographics of Population to re-segment its target Customer base. It may focus on micro-niches with higher disposable income (D.I.), deploy value-add product differentiators that shift price perception, or restructure its business process chain within Company.Cube to establish a cost floor below the industry baseline (Industry Cost) and maintain cost competitiveness.
An IC(P) spike (e.g., a 20% increase in energy or raw material costs) raises the industry Cost floor. If the firm operates in an elastic market where prices (Market Price) cannot be raised without destroying Volume (V), especially when Competitors absorb the margin losses by keeping the prices unchanged, the margin space compresses, eroding unit profit (P) and draining operating cash flow.
When consumer Confidence declines in Regional.Cube, buyers become risk-averse and price-sensitive. Demand shifts toward essential, value-oriented offerings. Attempting to raise prices (P↑) in a low-confidence environment leads to a sharp decline in Sales Volume (V↓).
Growth in Standard of Living raises Disposable Income; higher D.I. enlarges the overall demand potential (Population–D.I.) on the fourth Panel, which in turn expands the Customer demand (Customer↑) in the Market Cube. Volume expansion (V↑) then becomes achievable primarily from market growth rather than zero-sum share capture — although competition does not disappear, since the same growth also benefits rivals and may attract new entrants (Competitor↑).
Global Development Trends (e.g., cross-border e-commerce platforms or AI-driven logistics) lower international market entry barriers and widen the supply channels (IC(V)). On the other hand, this also enables local SMEs to expand their reach to foreign customers (Customer↑), diversifying revenue streams and strengthening enterprise Continuity (C).
Operating conditions vary significantly across regions. A product with high demand in a high-GDP, high-confidence region may fail in a low-disposable-income region. Mapping distinct Regional.Cubes enables management to tailor pricing, promotional messaging, and inventory allocation for each specific region.
Advanced regional technology infrastructure (e.g., 5G networks, cloud computing, automated logistics hubs) enables firms to implement real-time inventory tracking and automated order processing. This reduces operational lead times, lowers unit costs, and speeds up the Cash Conversion Cycle.
When profit declines, traditional management often slashes budgets across all departments by an arbitrary percentage (e.g., −20%). Tier 2 efficiency ratios reveal which functions are actually underperforming. If Marketing Efficiency is high (10× ROI) but Management Efficiency is depressed due to excessive administrative overhead, BCL directs cuts exclusively to administrative redundancies, protecting revenue-generating marketing engine.
In BCL, Make-or-Buy is a capacity-building decision evaluated through the Capacity & Capability Concept, the fixed-cost risk logic, and the IN-OUT framework:
A company shows paper profitability when sales revenue exceeds expenses on an accrual basis in the 1st Panel (Financial Performance Panel). However, if customer payment terms stretch Days Sales Outstanding (average collection period for Accounts Receivable) to 120 days while suppliers require payment in 30 days Days Payable Outstanding (average time taken to settle supplier payables), or if unsold inventory accumulates high Days Inventory Outstanding (average time inventory remains in stock before sale), cash becomes trapped in working capital. The firm experiences a cash drain, leaving it unable to cover payroll, rent, or debt service.
BCL derives this directly from the P–V trade-off: to maintain net profit unchanged requires P₁×V₁ = P₂×V₂. Solving for the required volume increase after a price cut:
Required Volume Growth (%) = Price Cut (%) / (Original Margin (%) − Price Cut (%)) × 100
Example: If a product with a 30% gross margin receives a 10% price cut, required volume must increase by 10% / (30% − 10%) = 50% just to break even on total gross margin.
But in BCL, the calculation is only the first step of the what-if analysis. Two further checks decide whether the cut is justified:
The Optimal Capacity Threshold is the operational sweet spot (typically 80%–88% utilization) where a plant operates at peak cost efficiency. Operating above 90% utilization increases machine wear, overtime labor premiums, and defect rates, which erodes Unit Profit (P).
The financial path (1st Panel): ROA = Profit/Asset. Excess inventory inflates the Asset element with idle, non-performing assets — cash is tied up and earning nothing — so the Asset base grows while Profit stays flat, and ROA falls even when Profitability (Profit/Revenue) is unchanged. The same effect shows in Asset Turnover (Revenue/Asset) slowing.
The operational root (Business Process Chain): In BCL, the causal question is why goods are sitting unsold:
Extending DPO shortens the Cash Conversion Cycle, preserves internal cash, and enhances Asset Turnover (Revenue/Total Assets). However, over-extending supplier payments damages supplier trust (Market.Cube). Suppliers may respond by revoking volume discounts, raising baseline supply prices (IC(P)↑), or prioritizing rival buyers during supply shortages (IC(V)↓), introducing risks to future IC(P) and IC(V).
In traditional organizations, Marketing optimizes for Volume (V), Production optimizes for unit cost efficiency (high-volume standardized runs), and Finance optimizes for cost containment. BCL forces all functions to share the 28-elements ontology and evaluate proposals on a single metric: net impact on Enterprise Continuity (C) and liquidity, preventing one department from achieving localized targets at the expense of overall enterprise objective.
In BCL, expansion risk is governed through the Capacity & Capability Concept and the Balance & Matching Concept, verified through sandbox what-if analysis:
BCL serves as the holistic business ontology and causal reasoning framework that grounds enterprise AI. Generative AI and predictive models excel at processing massive datasets and producing answers — but they lack a structural model of the whole business, enabling better communications between executives and AI: how a macro shift ripples down the micro-macro chain to an enterprise's P, V, and C, how a capacity expansion trades off against fixed-cost risk, or how a short-term P and V gains may erode C.
Concretely, BCL contributes three things to an AI-augmented decision process:
A BCL-Guided Prompt Template is a structured prompt architecture that inputs complex business problems into an AI model using the BCL ontology. Instead of asking open-ended questions (e.g., "How do we increase sales?"), a BCL prompt enforces explicit elements/parameters across internal capacity, market competitive dynamics, regional economic indicators, and liquidity bounds.
AI models frequently suggest strategies that sound plausible but are operationally unfeasible — for example, recommending a 300% sales growth target without accounting for current production capacity, financial strength, or the fixed-cost risk such expansion would create.
BCL counters this with three built-in feasibility mechanisms:
The vision is a BCL-powered executive decision-support environment — a living, continuously-updated sandbox in which AI does the monitoring and computation while management retains command of decisions:
Yes — it was developed, tested, and refined over twenty years in the boardrooms of Hong Kong and Mainland China before being codified in the book and white paper.
A revolutionary environmental change (digital technology, huge magnitude) phased out Kodak's film-based capacity faster than its capability could reshape it — a failure of holistic reasoning and timely capacity transformation, not of effort.
Capacity correlates positively with fixed cost. Film plants, machinery, and manpower became obsolete yet still carried costs, while the falling demand shrank revenue — the sandbox would have flagged phasing out lines and re-funding toward digital early.
GM's ever-growing fixed costs (payroll, production lines — entangled with union politics) eroded its capability to adapt to severe environmental change. Large capacity without adaptive capability turns scale into fragility.
JIT, Kanban, and lean production keep WIP minimal, detect faults in minutes rather than after shipment (a million-fold cost difference), and give flexibility to switch models — exceptional volume capacity paired with deep Continuity through continuous improvement.
Their entry into China's mid-tier market (~2008) was a move HP-LV → AP-AV to enlarge total profit, valid where AP×AV > HP×LV — justified by favorable market potential plus sufficient capacity and capability, exactly the sandbox's "How?" questions.
Facing a revolutionary shift (streaming), Netflix sensed the change, seized it, and reconfigured — from DVD distribution centers to streaming infrastructure, from logistics capability to content and algorithms — protecting C by building new capabilities while phasing out old ones.
If you can't find the answer you're looking for, reach out to us at BCL.Enquiry@businesscubelogics.com — our team will be happy to help.